Quant Analyzer Report
EURCAD
Source: MT5Report| Symbol | EURCAD | Period | unknown : 24.01.2022 - 20.12.2022 |
|---|---|---|---|
| Initial deposit | 1500.0 | ||
| Parameters | - | ||
Total Profit
96.94 %
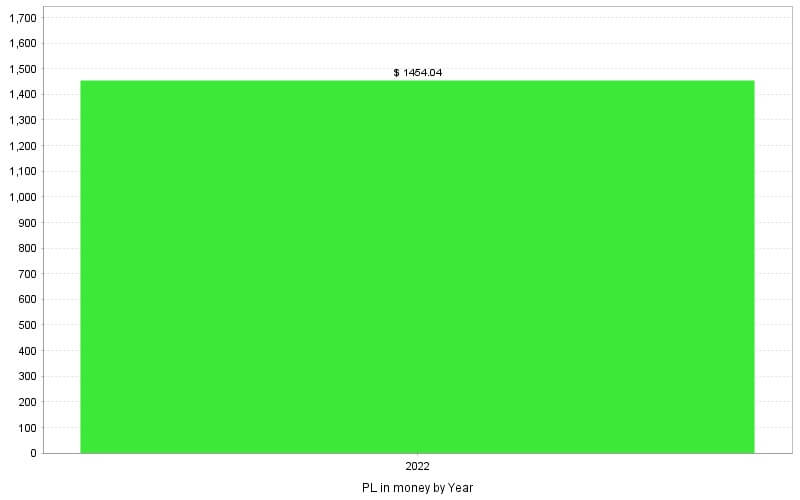
Profit in money
$ 1454.04
Yrly Avg profit
105.69 %
Yrly Avg % ret
105.69 %
CAGR
96.94 %
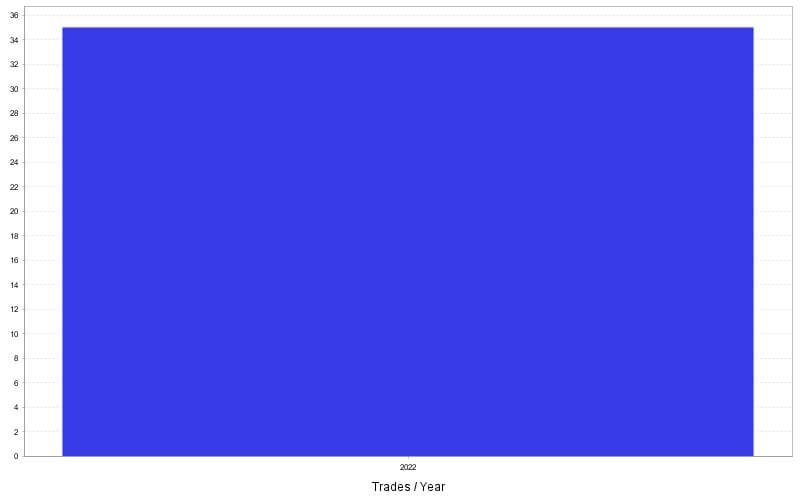
# of trades
35
Sharpe ratio
0.28
Profit factor
2.38
Return / DD ratio
5.41
Winning %
28.57 %
Drawdown
17.92 %
% Drawdown
17.92 %
Daily Avg profit
1.02 %
Mthly Avg profit
8.81 %
Average trade
41.54 %
Annual% / Max DD%
5.41
R Expectancy
0.99 R
R Exp score
37.75 R
SQN
1.49
SQN score
0.2
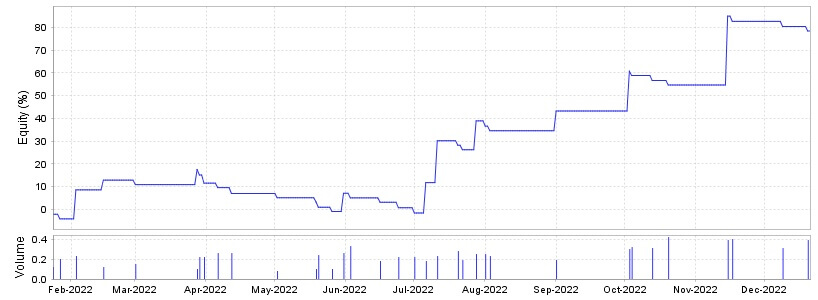
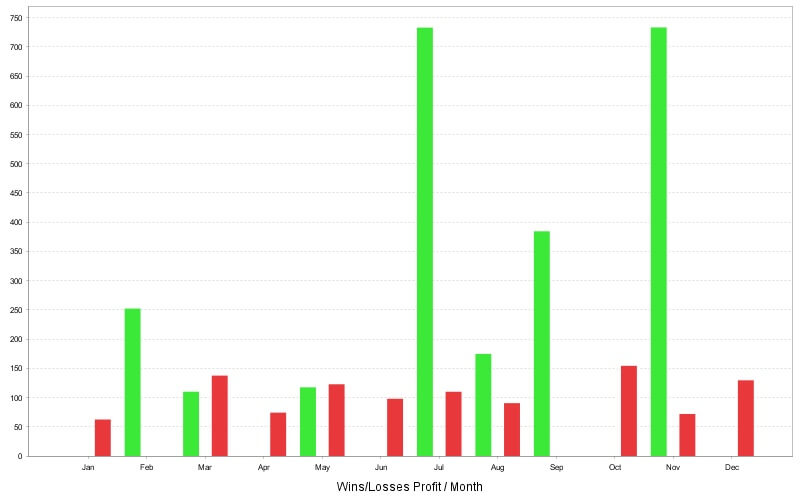
Monthly Performance (%)
| Year | Jan | Feb | Mar | Apr | May | Jun | Jul | Aug | Sep | Oct | Nov | Dec | YTD |
| 2022 | -4.21 | 17 | -1.32 | -4.51 | 0.06 | -6.32 | 38.16 | -4.34 | 8.66 | 11.43 | 27.99 | -4.24 | 78.36 |
Stats
Strategy
| Wins/Losses Ratio | 0.4 | Payout Ratio (Avg Win/Loss) | 5.96 | Average # of Bars in Trade | 0 |
| AHPR | 2.24 | Z-Score | -0.33 | Z-Probability | 62.93 % |
| Expectancy | 2.77 | Deviation | 40.3 % | Exposure | -999999999 % |
| Stagnation in Days | 115 | Stagnation in % | 34.74 % |
Trades
| # of Wins | 10 | # of Losses | 25 | # of Cancelled/Expired | 0 | ||
| Gross Profit | 166.99 % | Gross Loss | -70.06 % | Average Win | 16.7 % | Average Loss | -2.8 % |
| Largest Win | 48.88 % | Largest Loss | -4.79 % | Max Consec Wins | 2 | Max Consec Losses | 8 |
| Avg Consec Wins | 1.43 | Avg Consec Loss | 3.13 | Avg # of Bars in Wins | 0 | Avg # of Bars in Losses | 0 |
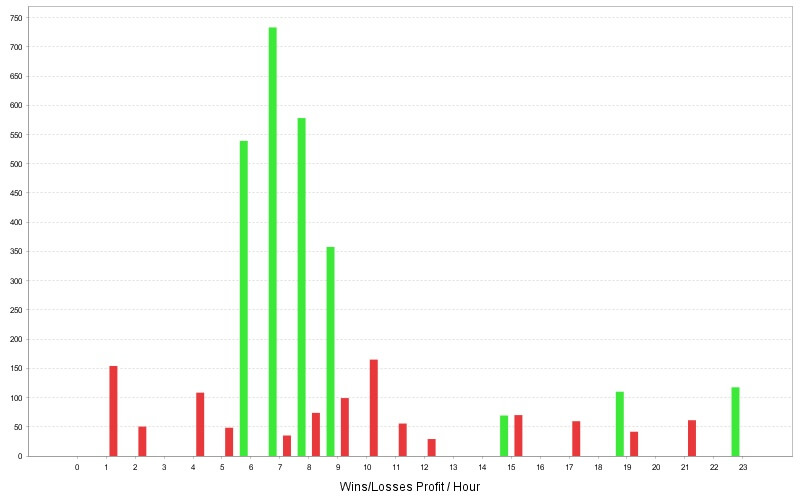
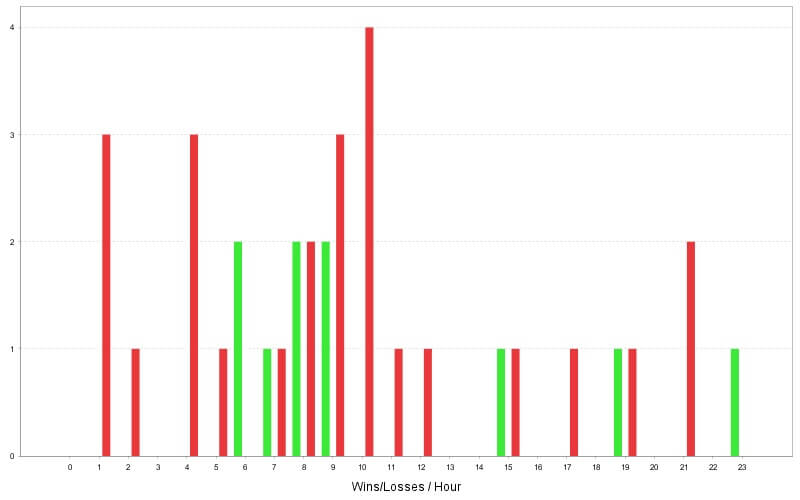
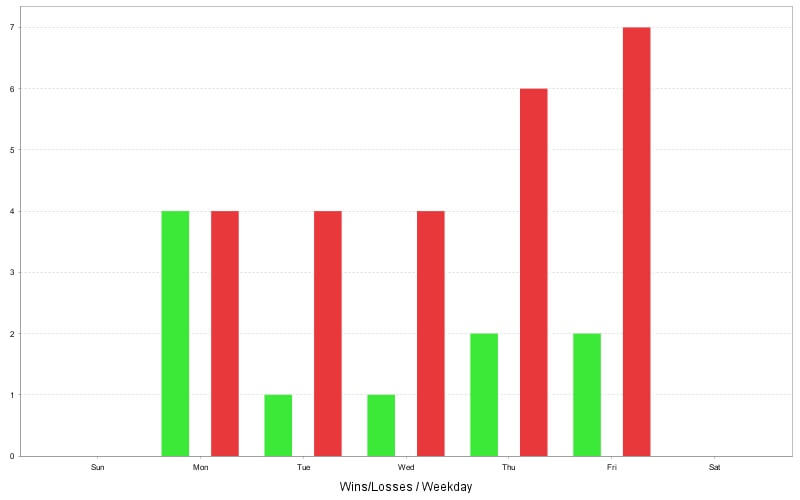
Charts
Click on the chart to see bigger image
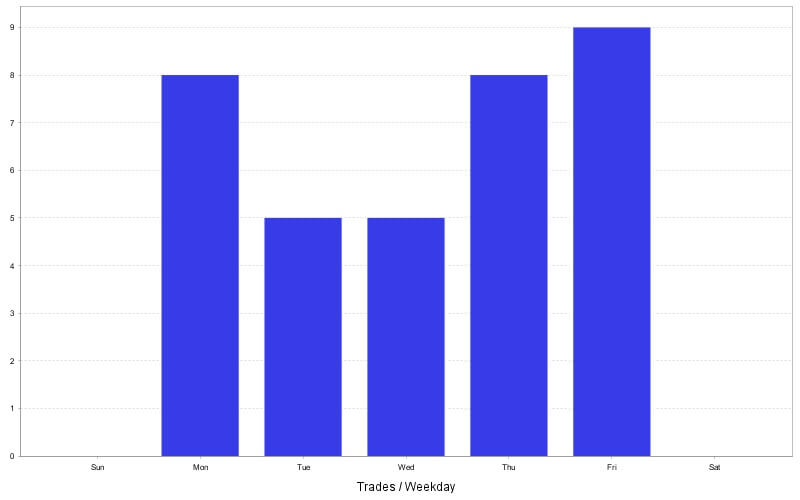

Trades
| Ticket | Type | Open time | Open price | Size | Close time | Close price | Profit/Loss | Comment |
| 2 | Buy | 24.01.2022 09:32:26 | 1.42553 | 0.12 | 24.01.2022 10:15:35 | 1.42208 | -2.2 % | sl 1.42208 |
| 4 | Sell | 27.01.2022 21:00:41 | 1.41799 | 0.2 | 27.01.2022 21:28:37 | 1.41987 | -2.01 % | sl 1.41986 |
| 6 | Buy | 02.02.2022 09:30:40 | 1.43024 | 0.23 | 03.02.2022 15:49:29 | 1.44085 | 12.73 % | |
| 8 | Sell | 07.02.2022 15:41:38 | 1.45344 | 0.12 | 15.02.2022 16:49:38 | 1.44608 | 4.27 % | sl 1.44608 |
| 10 | Sell | 01.03.2022 10:31:13 | 1.41975 | 0.15 | 01.03.2022 11:25:31 | 1.42252 | -1.94 % | sl 1.42252 |
| 12 | Sell | 18.03.2022 19:32:37 | 1.39363 | 0.1 | 28.03.2022 17:07:40 | 1.3798 | 6.64 % | sl 1.37979 |
| 14 | Buy | 29.03.2022 01:35:40 | 1.37637 | 0.22 | 29.03.2022 04:08:20 | 1.37392 | -2.44 % | sl 1.37392 |
| 16 | Buy | 30.03.2022 01:02:18 | 1.3867 | 0.22 | 31.03.2022 19:13:34 | 1.38371 | -3.58 % | sl 1.38372 |
| 18 | Sell | 06.04.2022 08:39:41 | 1.36115 | 0.26 | 06.04.2022 10:59:36 | 1.36272 | -1.96 % | sl 1.36271 |
| 20 | Buy | 11.04.2022 19:30:24 | 1.37403 | 0.26 | 12.04.2022 14:37:04 | 1.37218 | -2.55 % | sl 1.37219 |
| 22 | Buy | 02.05.2022 10:00:27 | 1.35709 | 0.08 | 02.05.2022 22:58:39 | 1.35221 | -1.91 % | sl 1.35221 |
| 24 | Sell | 13.05.2022 12:37:24 | 1.3511 | 0.1 | 19.05.2022 17:50:37 | 1.35482 | -1.86 % | sl 1.35482 |
| 26 | Buy | 20.05.2022 07:01:54 | 1.35605 | 0.24 | 20.05.2022 09:58:38 | 1.35418 | -2.29 % | sl 1.35418 |
| 28 | Sell | 26.05.2022 09:41:18 | 1.36891 | 0.1 | 26.05.2022 12:56:27 | 1.37254 | -1.9 % | sl 1.37254 |
| 30 | Sell | 30.05.2022 23:25:01 | 1.36425 | 0.26 | 31.05.2022 13:51:59 | 1.35852 | 8.02 % | |
| 32 | Sell | 03.06.2022 21:57:05 | 1.34911 | 0.33 | 03.06.2022 23:44:32 | 1.35032 | -2 % | sl 1.35031 |
| 34 | Sell | 16.06.2022 10:17:38 | 1.34461 | 0.18 | 16.06.2022 10:30:26 | 1.34676 | -1.93 % | sl 1.34676 |
| 36 | Buy | 24.06.2022 04:38:15 | 1.36742 | 0.22 | 24.06.2022 14:15:31 | 1.36528 | -2.39 % | sl 1.36529 |
| 38 | Buy | 01.07.2022 04:10:33 | 1.34878 | 0.22 | 01.07.2022 16:11:38 | 1.34674 | -2.33 % | sl 1.34674 |
| 40 | Sell | 04.07.2022 08:30:24 | 1.34376 | 0.18 | 06.07.2022 14:29:29 | 1.32972 | 13.36 % | |
| 42 | Sell | 07.07.2022 06:34:38 | 1.32811 | 0.23 | 11.07.2022 17:29:37 | 1.31101 | 18.37 % | |
| 44 | Sell | 20.07.2022 09:07:41 | 1.31684 | 0.28 | 20.07.2022 09:50:31 | 1.31858 | -1.95 % | sl 1.31856 |
| 46 | Sell | 22.07.2022 04:00:04 | 1.31404 | 0.19 | 22.07.2022 17:25:47 | 1.31657 | -1.96 % | sl 1.31656 |
| 48 | Sell | 26.07.2022 06:00:15 | 1.3133 | 0.25 | 28.07.2022 13:26:06 | 1.30115 | 12.68 % | |
| 50 | Buy | 01.08.2022 01:30:01 | 1.3096 | 0.25 | 01.08.2022 14:55:15 | 1.30708 | -2.34 % | sl 1.30708 |
| 52 | Sell | 03.08.2022 08:50:03 | 1.30811 | 0.23 | 03.08.2022 10:24:31 | 1.31041 | -2 % | sl 1.31041 |
| 54 | Buy | 29.08.2022 09:30:44 | 1.29848 | 0.19 | 01.09.2022 17:08:41 | 1.31147 | 8.66 % | sl 1.31148 |
| 56 | Buy | 29.09.2022 08:33:31 | 1.32367 | 0.3 | 03.10.2022 14:45:27 | 1.34163 | 17.54 % | sl 1.34163 |
| 58 | Sell | 04.10.2022 02:32:56 | 1.33964 | 0.32 | 04.10.2022 09:07:31 | 1.34178 | -1.95 % | sl 1.34178 |
| 60 | Buy | 13.10.2022 11:04:16 | 1.34105 | 0.31 | 13.10.2022 15:30:43 | 1.33856 | -2.2 % | sl 1.33857 |
| 62 | Sell | 20.10.2022 05:32:36 | 1.3456 | 0.42 | 20.10.2022 06:33:23 | 1.34719 | -1.96 % | sl 1.34719 |
| 64 | Buy | 11.11.2022 07:04:25 | 1.3588 | 0.39 | 15.11.2022 15:50:16 | 1.38406 | 30.27 % | |
| 66 | Buy | 17.11.2022 10:30:39 | 1.38515 | 0.4 | 17.11.2022 12:10:30 | 1.38275 | -2.28 % | sl 1.38276 |
| 68 | Buy | 09.12.2022 15:30:42 | 1.43895 | 0.31 | 09.12.2022 17:32:42 | 1.43587 | -2.27 % | sl 1.43592 |
| 70 | Sell | 20.12.2022 17:16:36 | 1.44689 | 0.39 | 20.12.2022 18:24:03 | 1.44897 | -1.98 % | sl 1.44896 |