Quant Analyzer Report
USDJPY
Source: MT5Report| Symbol | USDJPY | Period | unknown : 11.01.2022 - 21.12.2022 |
|---|---|---|---|
| Initial deposit | 1500.0 | ||
| Parameters | - | ||
Total Profit
60.82 %
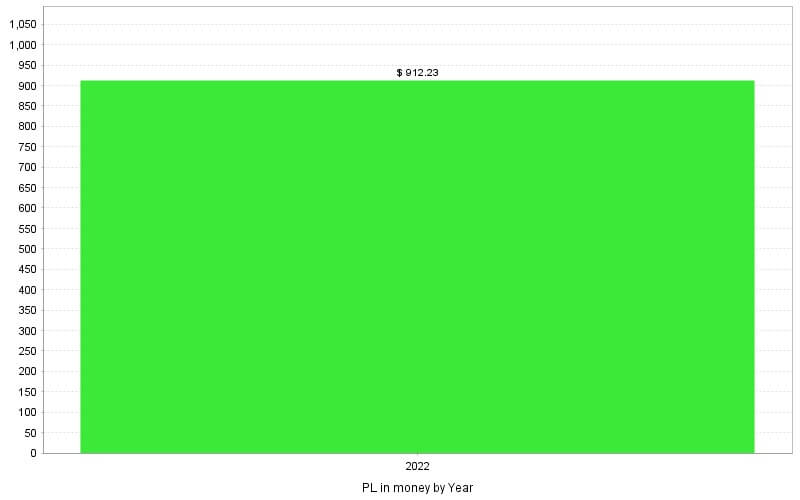
Profit in money
$ 912.23
Yrly Avg profit
72.98 %
Yrly Avg % ret
72.98 %
CAGR
60.82 %
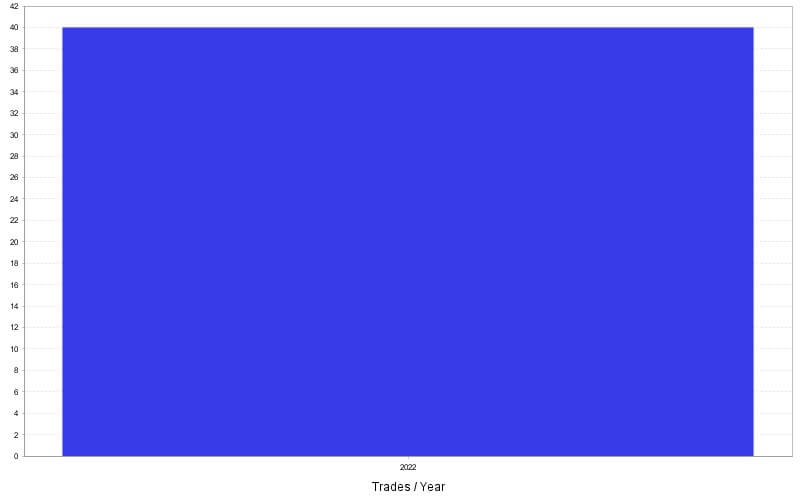
# of trades
40
Sharpe ratio
0.25
Profit factor
1.84
Return / DD ratio
5.72
Winning %
32.5 %
Drawdown
10.64 %
% Drawdown
10.64 %
Daily Avg profit
0.77 %
Mthly Avg profit
6.08 %
Average trade
22.81 %
Annual% / Max DD%
5.72
R Expectancy
0.57 R
R Exp score
27.13 R
SQN
1.46
SQN score
0.28
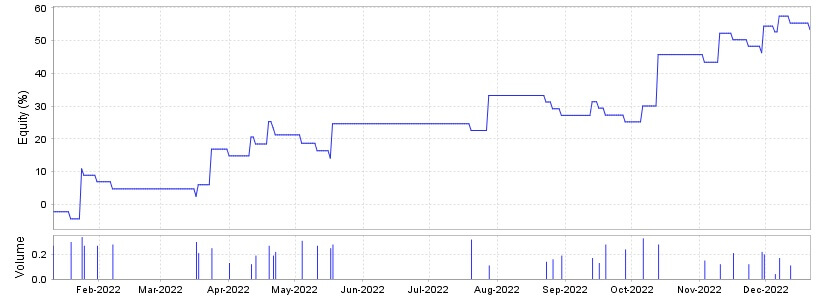
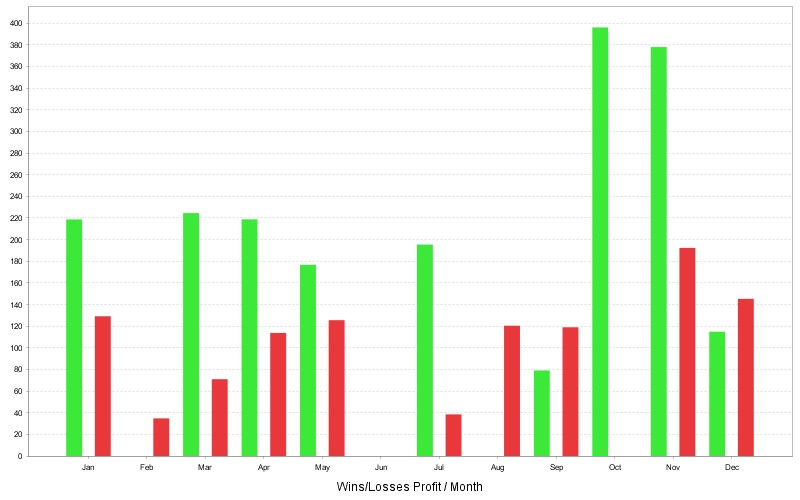
Monthly Performance (%)
| Year | Jan | Feb | Mar | Apr | May | Jun | Jul | Aug | Sep | Oct | Nov | Dec | YTD |
| 2022 | 6.94 | -2.19 | 12.13 | 4.36 | 3.38 | 0 | 8.64 | -6.08 | -1.97 | 20.52 | 8.67 | -1.08 | 53.31 |
Stats
Strategy
| Wins/Losses Ratio | 0.48 | Payout Ratio (Avg Win/Loss) | 3.82 | Average # of Bars in Trade | 0 |
| AHPR | 1.33 | Z-Score | 1.45 | Z-Probability | 7.35 % |
| Expectancy | 1.52 | Deviation | 22.28 % | Exposure | -999999999 % |
| Stagnation in Days | 101 | Stagnation in % | 29.36 % |
Trades
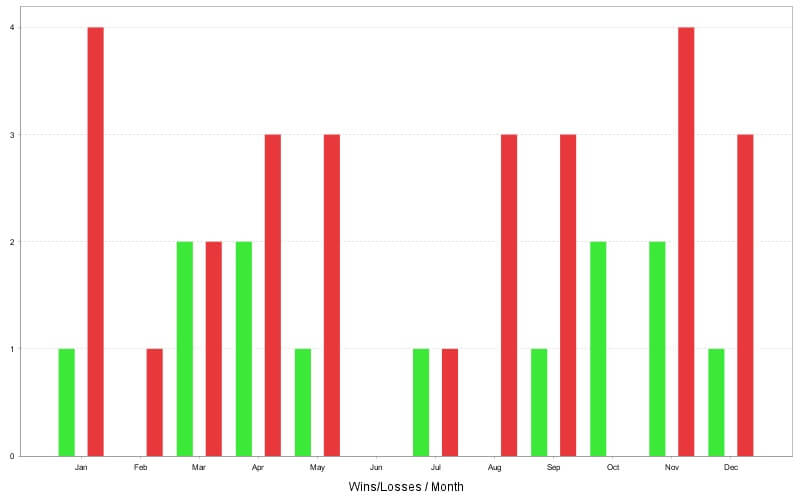
| # of Wins | 13 | # of Losses | 27 | # of Cancelled/Expired | 0 | ||
| Gross Profit | 133.45 % | Gross Loss | -72.64 % | Average Win | 10.27 % | Average Loss | -2.69 % |
| Largest Win | 20.38 % | Largest Loss | -3.56 % | Max Consec Wins | 2 | Max Consec Losses | 5 |
| Avg Consec Wins | 1.18 | Avg Consec Loss | 2.25 | Avg # of Bars in Wins | 0 | Avg # of Bars in Losses | 0 |
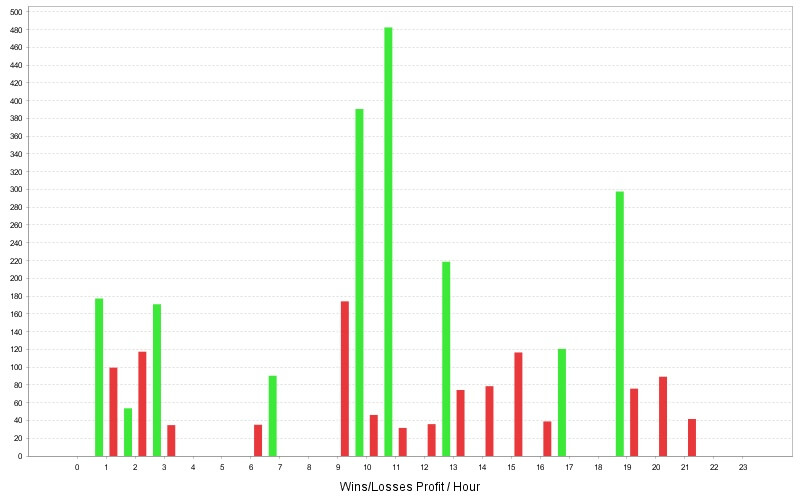
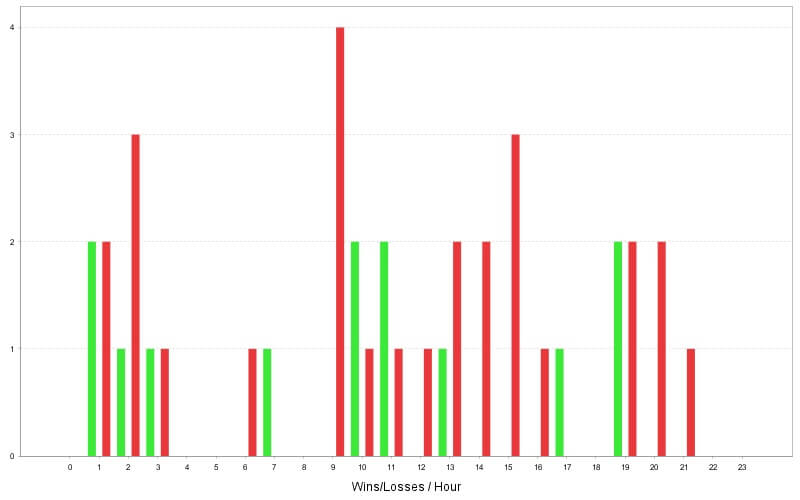
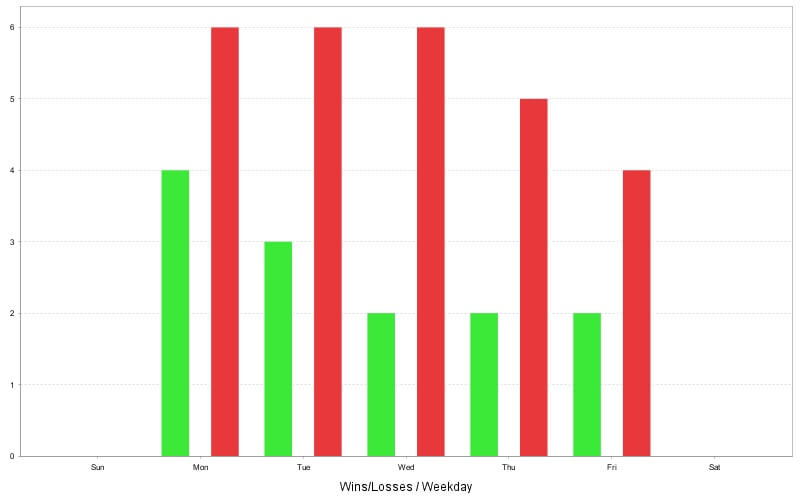
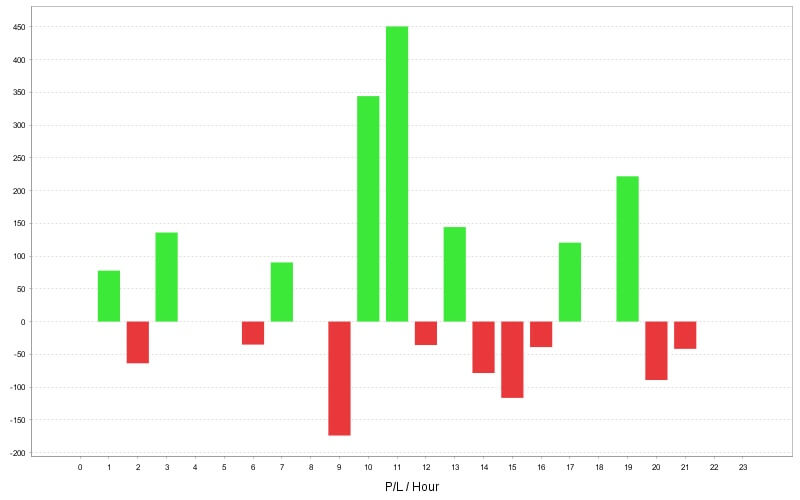
Charts
Click on the chart to see bigger image

Trades
| Ticket | Type | Open time | Open price | Size | Close time | Close price | Profit/Loss | Comment |
| 2 | Buy | 11.01.2022 19:56:50 | 115.489 | 0.27 | 11.01.2022 21:02:10 | 115.345 | -2.25 % | sl 115.345 |
| 4 | Buy | 17.01.2022 11:00:05 | 114.409 | 0.3 | 19.01.2022 07:23:55 | 114.279 | -2.16 % | sl 114.279 |
| 6 | Sell | 19.01.2022 13:01:37 | 114.467 | 0.34 | 24.01.2022 10:54:17 | 113.604 | 15.24 % | tp 113.604 |
| 8 | Sell | 25.01.2022 09:34:25 | 113.75 | 0.27 | 25.01.2022 09:59:15 | 113.886 | -1.95 % | sl 113.885 |
| 10 | Sell | 31.01.2022 02:01:18 | 115.232 | 0.27 | 31.01.2022 02:24:59 | 115.367 | -1.95 % | sl 115.365 |
| 12 | Buy | 07.02.2022 03:05:31 | 115.27 | 0.28 | 07.02.2022 10:28:25 | 115.127 | -2.19 % | sl 115.127 |
| 14 | Buy | 17.03.2022 06:06:16 | 118.727 | 0.3 | 17.03.2022 12:00:55 | 118.588 | -2.26 % | sl 118.588 |
| 16 | Buy | 18.03.2022 02:31:21 | 118.652 | 0.21 | 18.03.2022 09:10:38 | 118.956 | 3.53 % | tp 118.955 |
| 18 | Buy | 24.03.2022 03:31:25 | 121.096 | 0.25 | 24.03.2022 15:54:14 | 121.929 | 10.86 % | tp 121.929 |
| 20 | Sell | 31.03.2022 13:00:42 | 121.908 | 0.13 | 01.04.2022 04:23:05 | 122.218 | -2.05 % | sl 122.215 |
| 22 | Buy | 11.04.2022 01:41:34 | 124.376 | 0.12 | 11.04.2022 09:41:35 | 125.402 | 5.75 % | |
| 24 | Buy | 13.04.2022 15:03:18 | 125.862 | 0.19 | 13.04.2022 18:53:01 | 125.609 | -2.12 % | sl 125.609 |
| 26 | Buy | 18.04.2022 17:00:06 | 126.607 | 0.27 | 19.04.2022 02:32:30 | 127.17 | 6.82 % | tp 127.170 |
| 28 | Sell | 21.04.2022 12:00:37 | 128.024 | 0.19 | 21.04.2022 14:56:03 | 128.266 | -1.9 % | sl 128.265 |
| 30 | Buy | 22.04.2022 15:43:39 | 128.454 | 0.22 | 22.04.2022 16:44:41 | 128.223 | -2.14 % | sl 128.224 |
| 32 | Buy | 04.05.2022 01:00:48 | 130.142 | 0.31 | 04.05.2022 14:24:21 | 129.946 | -2.58 % | sl 129.949 |
| 34 | Sell | 10.05.2022 02:01:40 | 130.438 | 0.27 | 11.05.2022 15:38:31 | 130.606 | -2.28 % | sl 130.606 |
| 36 | Buy | 17.05.2022 14:00:26 | 129.357 | 0.25 | 17.05.2022 17:42:29 | 129.158 | -2.23 % | sl 129.158 |
| 38 | Sell | 18.05.2022 11:33:37 | 129.194 | 0.28 | 18.05.2022 18:07:37 | 128.384 | 10.47 % | tp 128.384 |
| 40 | Buy | 20.07.2022 13:00:32 | 138.184 | 0.32 | 20.07.2022 16:00:30 | 138.018 | -2.06 % | sl 138.018 |
| 42 | Sell | 22.07.2022 10:30:42 | 137.499 | 0.11 | 28.07.2022 15:44:28 | 134.944 | 10.7 % | tp 134.944 |
| 44 | Buy | 22.08.2022 14:01:35 | 137.077 | 0.14 | 23.08.2022 16:49:32 | 136.681 | -1.98 % | sl 136.689 |
| 46 | Sell | 25.08.2022 20:01:18 | 136.619 | 0.16 | 26.08.2022 09:18:33 | 136.947 | -2.09 % | sl 136.947 |
| 48 | Buy | 29.08.2022 16:03:47 | 138.545 | 0.19 | 30.08.2022 11:16:27 | 138.257 | -2.01 % | sl 138.258 |
| 50 | Sell | 13.09.2022 01:30:05 | 142.535 | 0.17 | 13.09.2022 15:28:53 | 141.875 | 4.16 % | |
| 52 | Buy | 16.09.2022 09:05:25 | 143.635 | 0.13 | 16.09.2022 12:16:21 | 143.209 | -1.95 % | sl 143.209 |
| 54 | Buy | 19.09.2022 21:04:24 | 143.371 | 0.28 | 19.09.2022 22:59:27 | 143.158 | -2.15 % | sl 143.159 |
| 56 | Buy | 27.09.2022 15:00:27 | 144.467 | 0.24 | 28.09.2022 18:53:05 | 144.23 | -2.03 % | sl 144.230 |
| 58 | Buy | 06.10.2022 07:10:42 | 144.605 | 0.33 | 06.10.2022 19:12:03 | 145.002 | 4.86 % | tp 145.001 |
| 60 | Buy | 10.10.2022 11:00:26 | 145.448 | 0.28 | 13.10.2022 15:30:38 | 147.029 | 15.67 % | tp 147.028 |
| 62 | Sell | 02.11.2022 01:42:30 | 147.922 | 0.15 | 03.11.2022 12:24:28 | 148.363 | -2.33 % | sl 148.363 |
| 64 | Sell | 07.11.2022 10:30:16 | 147.052 | 0.12 | 10.11.2022 15:31:41 | 144.57 | 8.85 % | tp 144.570 |
| 66 | Sell | 16.11.2022 20:01:33 | 139.352 | 0.21 | 16.11.2022 20:34:34 | 139.67 | -1.99 % | sl 139.669 |
| 68 | Buy | 18.11.2022 10:49:28 | 140.171 | 0.12 | 23.11.2022 18:11:03 | 139.619 | -1.97 % | sl 139.621 |
| 70 | Sell | 29.11.2022 02:00:01 | 138.713 | 0.22 | 29.11.2022 03:07:17 | 139.001 | -1.98 % | sl 139.000 |
| 72 | Buy | 29.11.2022 19:30:27 | 138.532 | 0.2 | 30.11.2022 17:32:29 | 139.805 | 8.09 % | tp 139.803 |
| 74 | Sell | 02.12.2022 19:30:27 | 134.569 | 0.04 | 05.12.2022 17:00:05 | 135.973 | -1.72 % | sl 135.973 |
| 76 | Buy | 06.12.2022 19:00:00 | 136.69 | 0.17 | 07.12.2022 08:26:19 | 137.615 | 4.79 % | tp 137.614 |
| 78 | Sell | 08.12.2022 09:01:05 | 136.624 | 0.11 | 12.12.2022 15:20:31 | 137.236 | -2.12 % | sl 137.234 |
| 80 | Sell | 21.12.2022 09:44:27 | 131.894 | 0.14 | 21.12.2022 16:01:30 | 132.365 | -2.02 % | sl 132.365 |