Quant Analyzer Report
XAUUSD
Source: MT5Report| Symbol | XAUUSD | Period | unknown : 05.01.2022 - 23.12.2022 |
|---|---|---|---|
| Initial deposit | 1500.0 | ||
| Parameters | - | ||
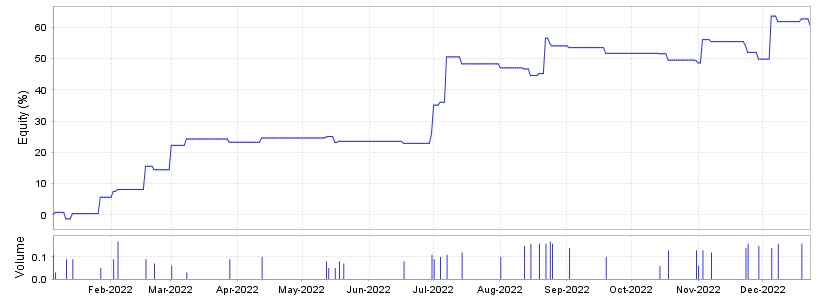
Total Profit
75.93 %
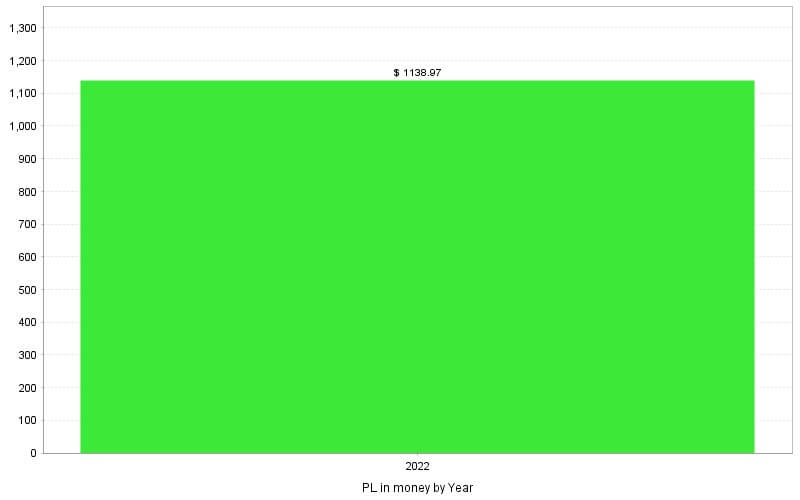
Profit in money
$ 1138.97
Yrly Avg profit
75.99 %
Yrly Avg % ret
75.99 %
CAGR
75.93 %
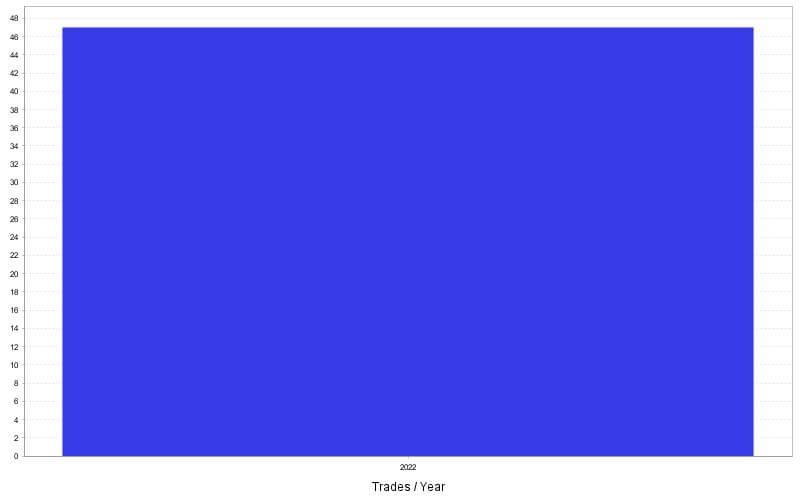
# of trades
47
Sharpe ratio
0.31
Profit factor
2.55
Return / DD ratio
9.93
Winning %
44.68 %
Drawdown
7.65 %
% Drawdown
7.65 %
Daily Avg profit
1.33 %
Mthly Avg profit
6.33 %
Average trade
24.23 %
Annual% / Max DD%
9.93
R Expectancy
0.86 R
R Exp score
40.42 R
SQN
1.84
SQN score
0.41
Monthly Performance (%)
| Year | Jan | Feb | Mar | Apr | May | Jun | Jul | Aug | Sep | Oct | Nov | Dec | YTD |
| 2022 | 5.63 | 8.81 | 8.76 | 1.37 | -1.07 | 2.49 | 22.28 | 5.72 | -2.39 | -2.33 | 0.5 | 10.87 | 60.66 |
Stats
Strategy
| Wins/Losses Ratio | 0.81 | Payout Ratio (Avg Win/Loss) | 3.16 | Average # of Bars in Trade | 0 |
| AHPR | 1.29 | Z-Score | -0.52 | Z-Probability | 69.85 % |
| Expectancy | 1.62 | Deviation | 23.4 % | Exposure | -999999999 % |
| Stagnation in Days | 106 | Stagnation in % | 30.03 % |
Trades
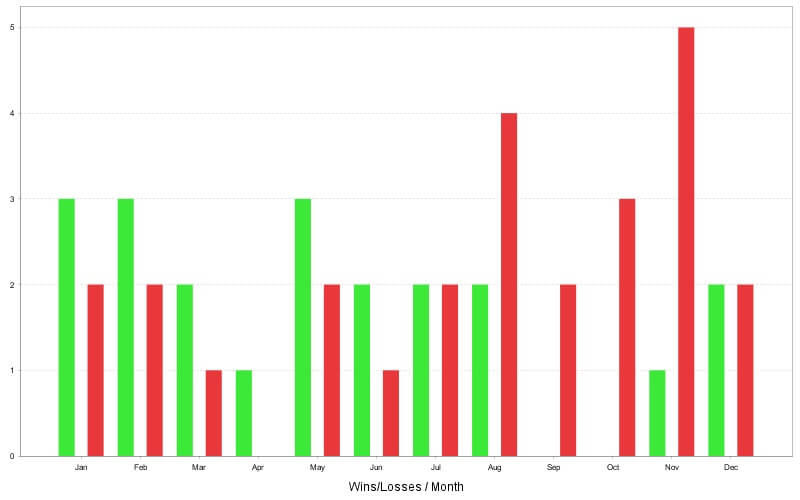
| # of Wins | 21 | # of Losses | 26 | # of Cancelled/Expired | 0 | ||
| Gross Profit | 124.77 % | Gross Loss | -48.84 % | Average Win | 5.94 % | Average Loss | -1.88 % |
| Largest Win | 21.88 % | Largest Loss | -3.61 % | Max Consec Wins | 4 | Max Consec Losses | 8 |
| Avg Consec Wins | 1.91 | Avg Consec Loss | 2.17 | Avg # of Bars in Wins | 0 | Avg # of Bars in Losses | 0 |
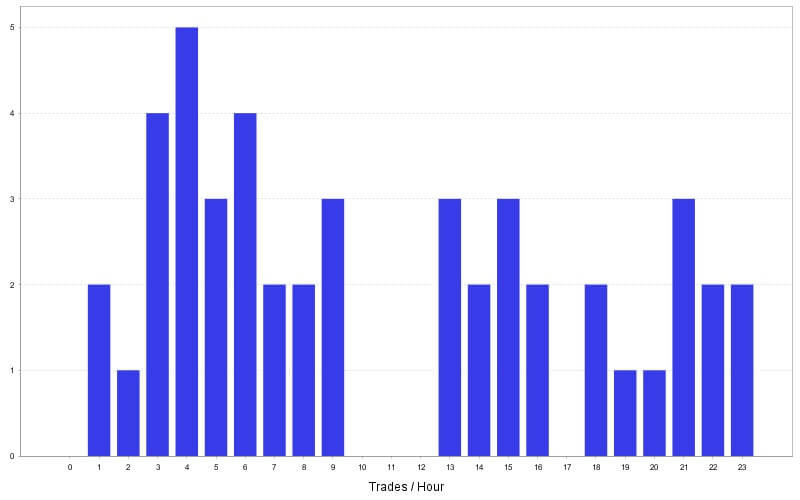
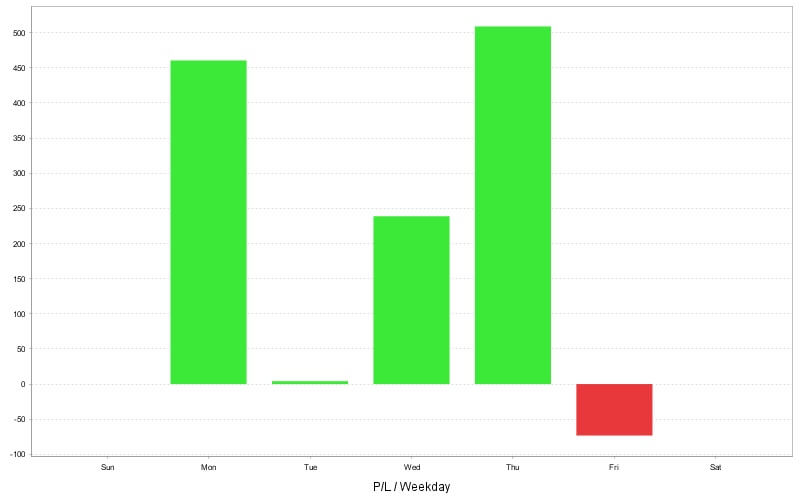
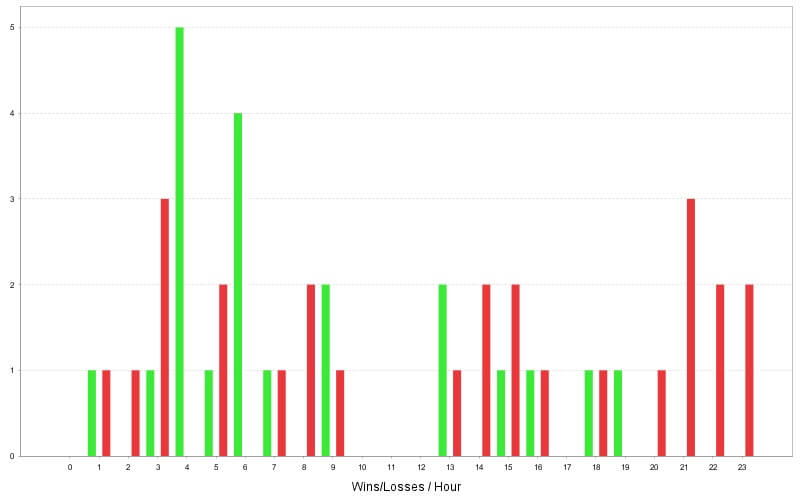
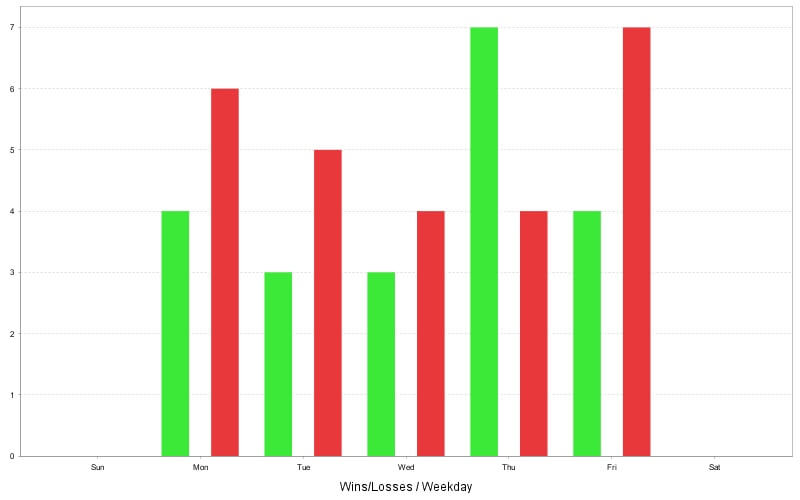
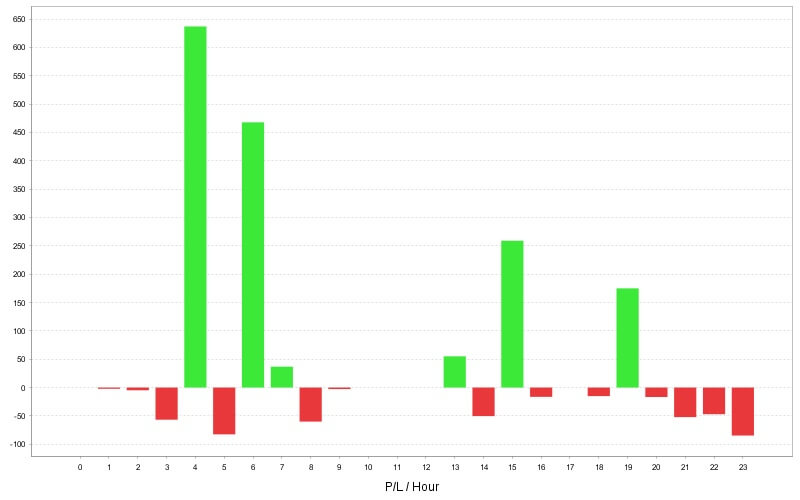
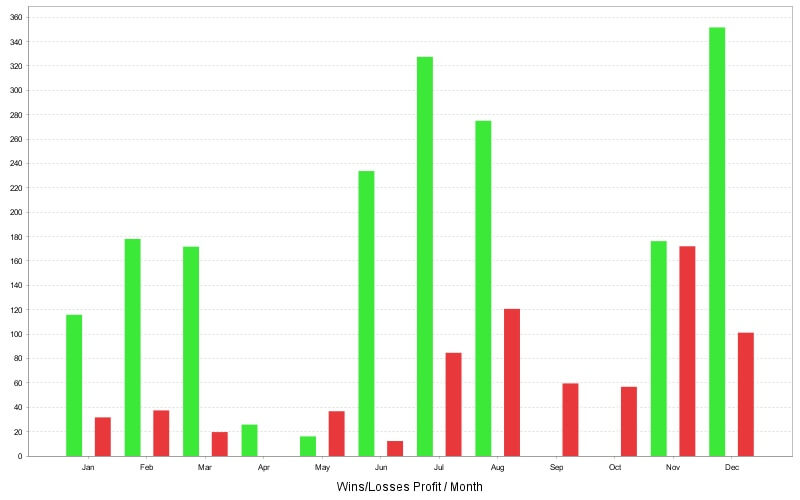
Charts
Click on the chart to see bigger image
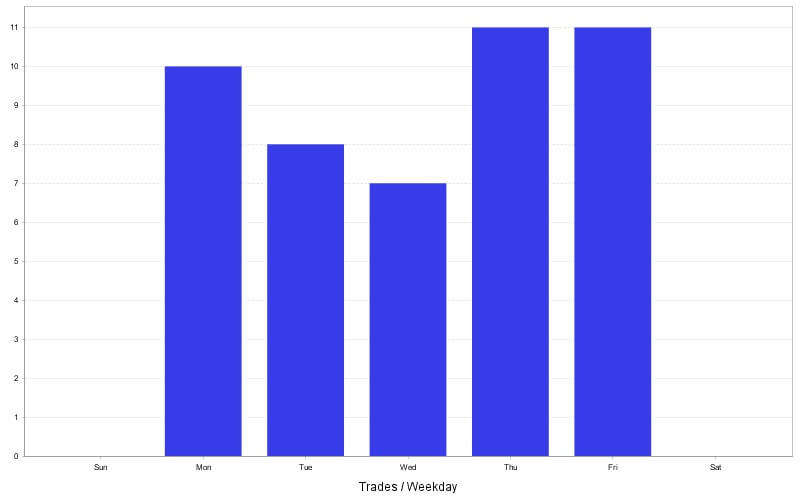
Trades
| Ticket | Type | Open time | Open price | Size | Close time | Close price | Profit/Loss | Comment |
| 2 | Buy | 05.01.2022 03:30:35 | 1814.582 | 0.11 | 05.01.2022 07:45:22 | 1814.547 | -0.03 % | sl 1814.550 |
| 4 | Sell | 06.01.2022 13:47:38 | 1797.269 | 0.03 | 06.01.2022 16:33:36 | 1793.112 | 0.83 % | sl 1793.100 |
| 6 | Buy | 11.01.2022 14:30:46 | 1807.624 | 0.09 | 11.01.2022 16:01:38 | 1804.146 | -2.07 % | sl 1804.150 |
| 8 | Buy | 14.01.2022 03:30:36 | 1822.974 | 0.09 | 14.01.2022 10:45:04 | 1825.745 | 1.68 % | sl 1825.750 |
| 10 | Sell | 27.01.2022 13:00:30 | 1811.267 | 0.05 | 27.01.2022 20:20:14 | 1795.58 | 5.21 % | sl 1795.580 |
| 12 | Buy | 02.02.2022 16:31:30 | 1803.936 | 0.09 | 02.02.2022 21:59:12 | 1807.23 | 1.87 % | sl 1807.230 |
| 14 | Buy | 04.02.2022 09:00:37 | 1807.503 | 0.13 | 04.02.2022 15:30:29 | 1809.664 | 1.74 % | sl 1809.670 |
| 16 | Sell | 04.02.2022 18:01:04 | 1803.304 | 0.04 | 04.02.2022 21:00:01 | 1807.885 | -1.12 % | sl 1807.850 |
| 18 | Buy | 17.02.2022 04:00:04 | 1870.523 | 0.09 | 17.02.2022 13:35:37 | 1883.891 | 7.41 % | sl 1883.910 |
| 20 | Sell | 21.02.2022 14:00:27 | 1894.176 | 0.07 | 21.02.2022 18:11:37 | 1896.903 | -1.09 % | sl 1896.880 |
| 22 | Buy | 01.03.2022 06:00:27 | 1905.919 | 0.06 | 01.03.2022 17:46:37 | 1928.255 | 7.77 % | |
| 24 | Buy | 08.03.2022 07:00:14 | 1991.62 | 0.03 | 08.03.2022 15:00:43 | 2004.186 | 2.03 % | sl 2004.200 |
| 26 | Buy | 25.03.2022 21:30:39 | 1955.524 | 0.09 | 28.03.2022 04:10:41 | 1953.48 | -1.03 % | sl 1953.500 |
| 28 | Buy | 12.04.2022 04:02:40 | 1952.9 | 0.1 | 12.04.2022 10:09:02 | 1955.478 | 1.37 % | sl 1955.500 |
| 30 | Buy | 12.05.2022 01:00:39 | 1852.99 | 0.08 | 12.05.2022 05:44:15 | 1853.738 | 0.31 % | sl 1853.740 |
| 32 | Sell | 13.05.2022 18:29:27 | 1811.861 | 0.05 | 13.05.2022 23:43:20 | 1811.22 | 0.17 % | sl 1811.210 |
| 34 | Sell | 16.05.2022 13:00:30 | 1799.751 | 0.05 | 16.05.2022 15:33:29 | 1806.916 | -1.87 % | sl 1806.890 |
| 36 | Sell | 18.05.2022 04:06:39 | 1815.951 | 0.08 | 18.05.2022 10:25:29 | 1815.09 | 0.37 % | sl 1815.080 |
| 38 | Buy | 20.05.2022 07:00:02 | 1841.826 | 0.07 | 20.05.2022 14:55:32 | 1841.697 | -0.05 % | sl 1841.700 |
| 40 | Buy | 17.06.2022 08:00:29 | 1846.023 | 0.08 | 17.06.2022 10:00:19 | 1844.487 | -0.65 % | sl 1844.490 |
| 42 | Sell | 30.06.2022 06:30:00 | 1818.567 | 0.11 | 30.06.2022 15:42:17 | 1813.223 | 3.14 % | sl 1813.150 |
| 44 | Sell | 30.06.2022 19:38:12 | 1810.499 | 0.09 | 01.07.2022 16:03:20 | 1790.983 | 9.07 % | sl 1790.950 |
| 46 | Buy | 04.07.2022 05:02:03 | 1808.697 | 0.1 | 04.07.2022 09:31:16 | 1810.671 | 0.94 % | sl 1810.690 |
| 48 | Sell | 06.07.2022 04:52:28 | 1768.851 | 0.11 | 07.07.2022 02:37:35 | 1740.65 | 14.49 % | sl 1740.640 |
| 50 | Buy | 13.07.2022 23:30:34 | 1735.527 | 0.12 | 14.07.2022 02:39:56 | 1731.419 | -2.22 % | sl 1731.420 |
| 52 | Buy | 29.07.2022 23:31:27 | 1765.617 | 0.1 | 01.08.2022 02:20:35 | 1762.69 | -1.29 % | sl 1762.720 |
| 54 | Sell | 12.08.2022 01:37:38 | 1788.447 | 0.15 | 12.08.2022 05:55:11 | 1788.992 | -0.35 % | sl 1788.990 |
| 56 | Buy | 15.08.2022 03:31:19 | 1799.754 | 0.16 | 15.08.2022 05:02:20 | 1796.67 | -2.11 % | sl 1796.674 |
| 58 | Sell | 19.08.2022 06:34:30 | 1755.424 | 0.16 | 19.08.2022 15:33:29 | 1754.563 | 0.6 % | sl 1754.560 |
| 60 | Sell | 22.08.2022 06:39:36 | 1746.292 | 0.16 | 22.08.2022 15:26:18 | 1729.963 | 11.35 % | |
| 62 | Buy | 23.08.2022 22:35:37 | 1747.715 | 0.17 | 24.08.2022 04:02:01 | 1745.255 | -1.72 % | sl 1745.290 |
| 64 | Buy | 24.08.2022 21:00:02 | 1749.776 | 0.16 | 25.08.2022 01:02:18 | 1748.98 | -0.76 % | sl 1749.120 |
| 66 | Sell | 01.09.2022 21:03:40 | 1696.58 | 0.14 | 02.09.2022 02:45:26 | 1697.467 | -0.54 % | sl 1697.410 |
| 68 | Sell | 19.09.2022 16:30:00 | 1662.94 | 0.1 | 19.09.2022 16:45:25 | 1667.549 | -1.85 % | sl 1667.540 |
| 70 | Sell | 13.10.2022 22:33:04 | 1664.437 | 0.06 | 14.10.2022 04:44:38 | 1664.857 | -0.12 % | sl 1664.840 |
| 72 | Sell | 18.10.2022 05:06:23 | 1650.431 | 0.13 | 18.10.2022 07:02:37 | 1654.198 | -2.01 % | sl 1654.178 |
| 74 | Sell | 31.10.2022 02:24:37 | 1643.255 | 0.13 | 31.10.2022 05:49:01 | 1643.628 | -0.2 % | sl 1643.620 |
| 76 | Buy | 01.11.2022 20:00:19 | 1649.285 | 0.06 | 01.11.2022 22:26:11 | 1646.5 | -0.7 % | sl 1646.500 |
| 78 | Sell | 03.11.2022 04:00:26 | 1637.96 | 0.13 | 03.11.2022 14:06:26 | 1624.401 | 7.44 % | sl 1624.390 |
| 80 | Buy | 07.11.2022 15:00:03 | 1677.401 | 0.12 | 07.11.2022 19:48:04 | 1675.992 | -0.66 % | sl 1676.000 |
| 82 | Sell | 23.11.2022 03:30:34 | 1739.406 | 0.14 | 23.11.2022 09:22:28 | 1741.688 | -1.26 % | sl 1741.660 |
| 84 | Buy | 24.11.2022 09:00:40 | 1755.79 | 0.16 | 24.11.2022 10:07:14 | 1752.405 | -2.17 % | sl 1752.410 |
| 86 | Buy | 29.11.2022 15:00:02 | 1755.487 | 0.15 | 29.11.2022 15:13:15 | 1751.999 | -2.14 % | sl 1752.017 |
| 88 | Sell | 05.12.2022 15:30:37 | 1794.971 | 0.14 | 05.12.2022 19:08:53 | 1771.526 | 13.74 % | tp 1771.527 |
| 90 | Buy | 08.12.2022 08:11:27 | 1784.852 | 0.16 | 08.12.2022 11:36:39 | 1781.865 | -1.76 % | sl 1781.870 |
| 92 | Buy | 19.12.2022 09:29:05 | 1793.635 | 0.16 | 19.12.2022 13:03:23 | 1795.095 | 0.88 % | sl 1795.110 |
| 94 | Sell | 23.12.2022 05:00:02 | 1792.69 | 0.19 | 23.12.2022 07:11:53 | 1795.5 | -1.98 % | sl 1795.500 |